

Free Piktochart Alternatives for Infographics, Reports and Charts
Piktochart is a popular way to turn numbers and ideas into infographics, reports and slides, but its free plan is built for trying the tool, not for regular work. If you need to make visuals every week in 2027 without paying, there are better free options, from all-round design apps to dedicated chart and map makers. We checked every free plan below on the tool's official pricing page (default view) at the turn of October and November 2026, removed the tools from the 2025 version of this list that are not really infographic makers, and added the free data visualization tools that journalists and analysts use.
Quick answer: for infographics and reports, use Canva Free or Visme Basic (unlimited projects; Visme's downloads start on its paid Starter plan). For charts and maps you can embed on your website, use Datawrapper or Flourish; for an interactive infographic, Infogram or Genially. If your data must stay on your own computer, RAWGraphs is free, open source and processes the data only in your browser. Adobe Express, DocHipo, Venngage and Easil are good free template tools for one-off visuals.
Boost Your SEO by Getting Featured in Our Blogs and get a backlink.
We publish content about startups, education, tech, funding, etc. that ranks well not only in Google but also in Perplexity, ChatGPT, Grok and other AI tools.
👉 Get featured now!
What Does Piktochart's Free Plan Include?
The Piktochart pricing page lists the Free plan at $0 with unlimited visual projects, 2 PNG downloads, 60 AI credits, free templates only, 1 GB of storage and one folder, for 1 to 4 team members. That is fine for testing, but the 2 downloads are the real limit: as soon as you need to publish more than a couple of visuals, you have to upgrade. Pro costs $10 per member a month billed annually ($15 billed monthly) and unlocks unlimited PNG downloads; PDF and PowerPoint downloads start with the Business plan at $17 per member a month billed annually. The tools below let you make and export more for free.
Free Piktochart Alternatives Compared
Sources: each tool's official pricing and product pages, default view, checked 31 October to 1 November 2026. US dollars unless the page showed euros from our location; prices can differ by region and billing cycle.
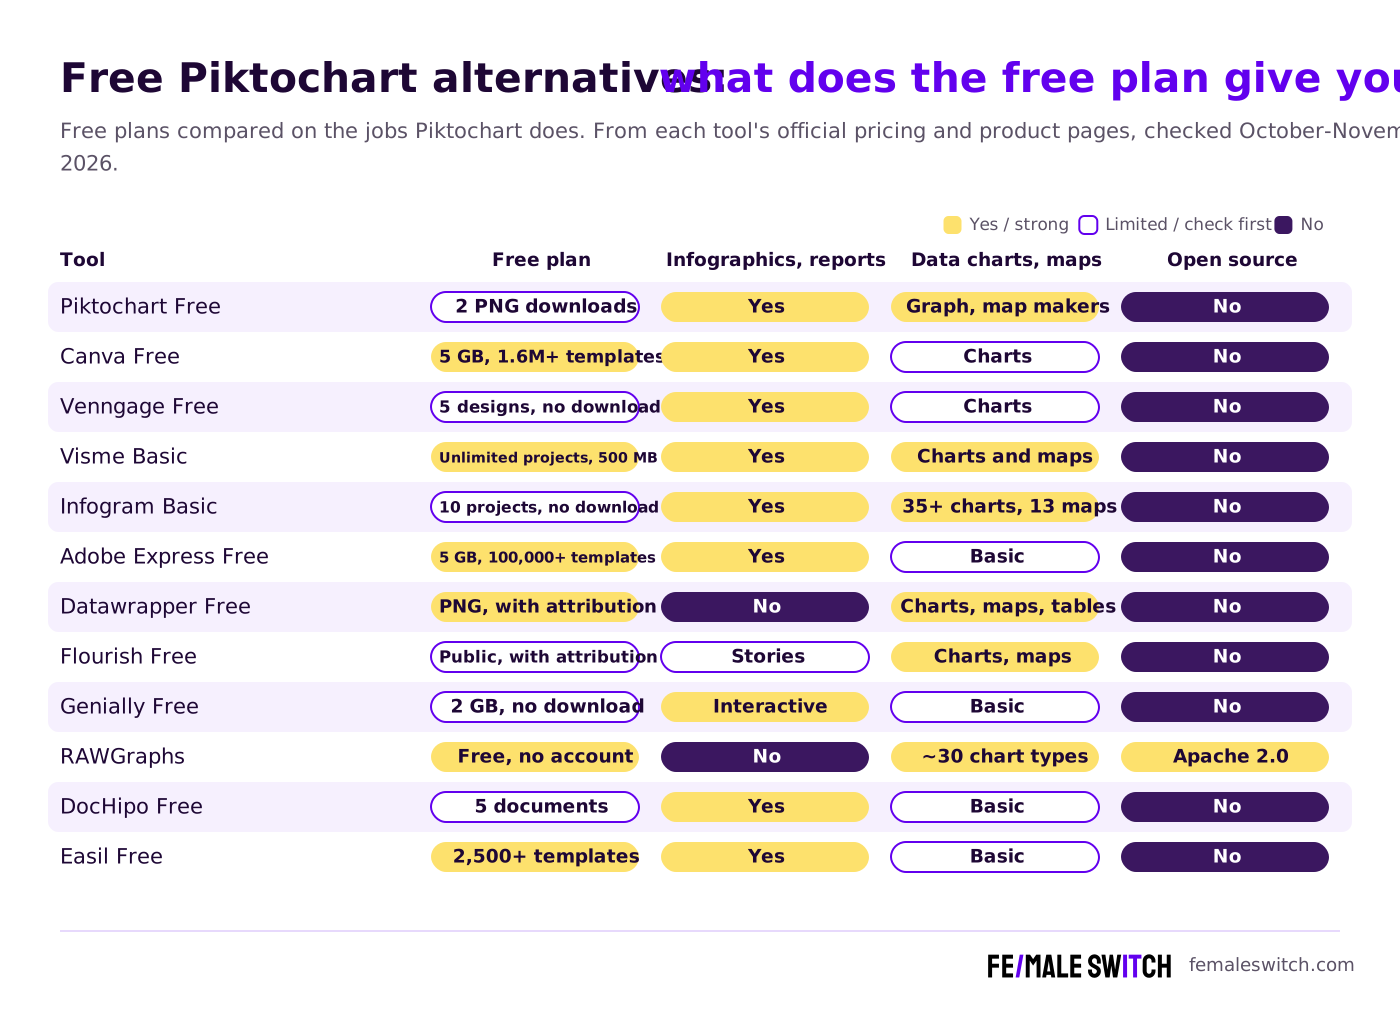
The Best Free Piktochart Alternatives in 2027
1. Canva Free: the all-round design tool
Canva is the easiest switch for most Piktochart users, because it covers infographics, reports, presentations and social posts in one editor. According to the Canva pricing page, Canva Free gives you the drag-and-drop editor with more than 1,000 design types, over 1.6 million templates, over 4.7 million photos, videos, graphics and audio files, one Brand Kit with 3 colours, 5GB of cloud storage and limited access to its AI tools. Charts are built in, but for data-heavy work a dedicated chart tool such as Datawrapper or Flourish gives you more control. If you outgrow the free plan, compare the options in our list of free Canva Pro alternatives.
2. Visme Basic: unlimited projects, downloads on paid plans
Visme is the closest like-for-like replacement for Piktochart: infographics, reports, presentations, charts and maps in one tool. The Visme pricing page lists the Basic plan at $0 with unlimited projects, 500MB of storage, up to 50 slides or pages per project and a limited set of templates and design assets. Downloads as JPG, PNG and PDF are listed from the paid Starter plan, which costs US$12.25 a month, billed $147 a year. Use Visme Basic to build and share projects online; if you need free downloads, look at DocHipo or Datawrapper below.
3. Venngage Free: AI infographics from a prompt
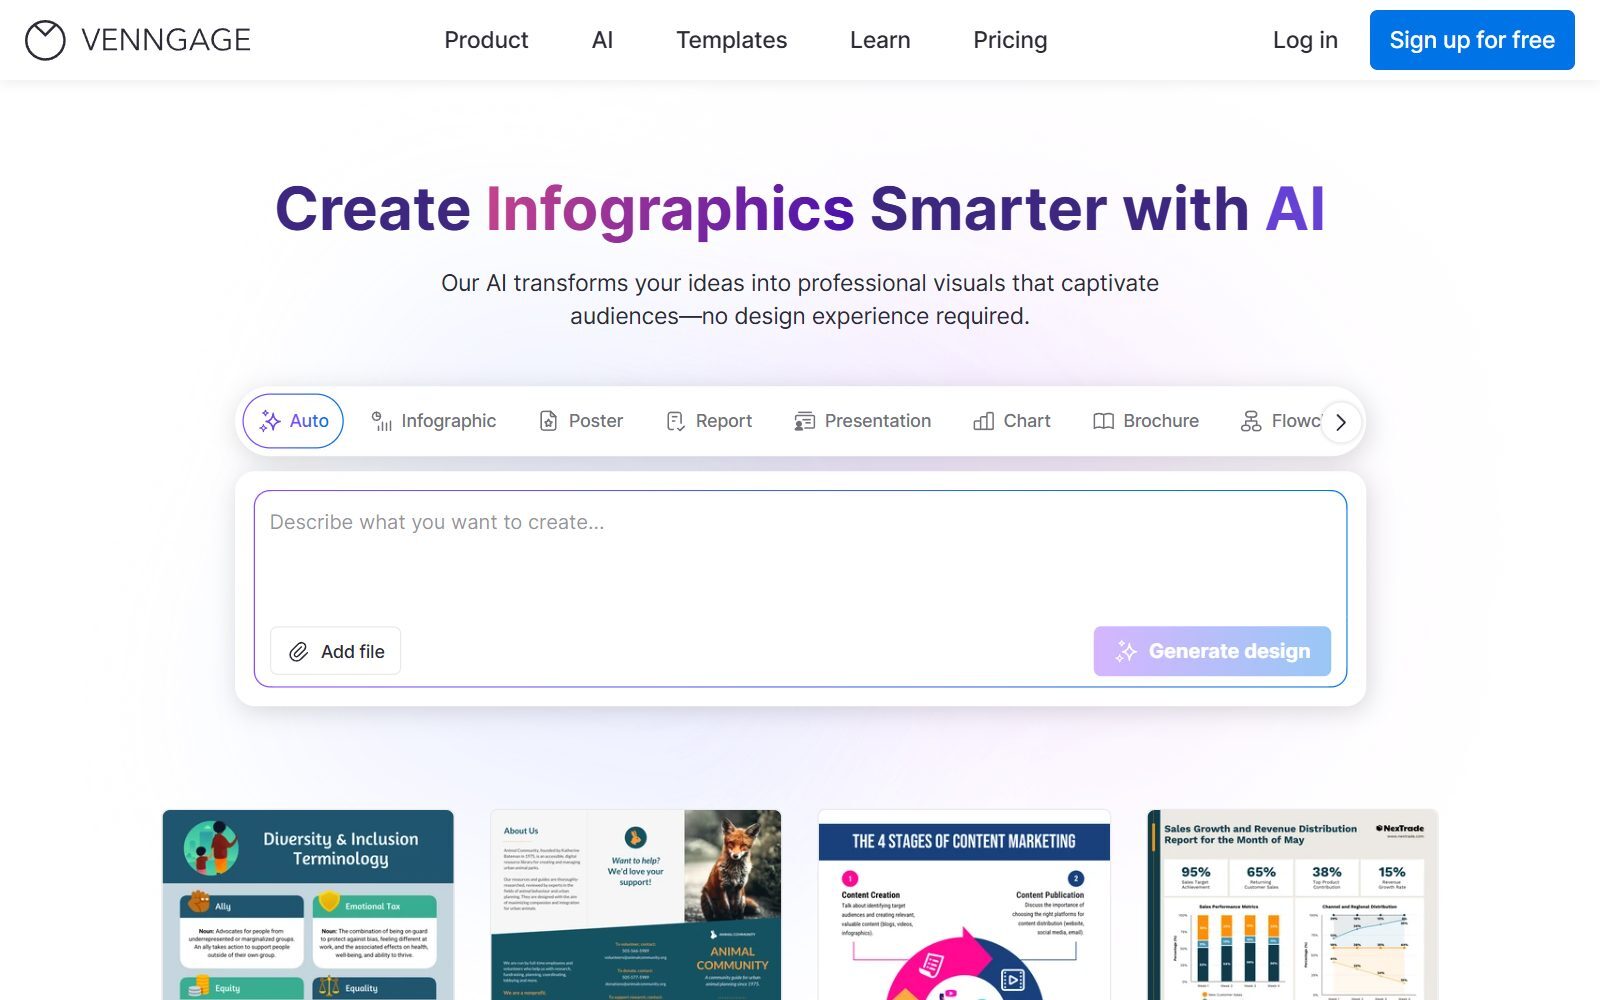
Venngage focuses on infographics, reports, posters and charts, and its homepage now starts with an AI box where you describe what you want. The Venngage pricing page lists the Free plan at $0 with 5 designs, 80 daily AI credits at signup, 6 image uploads and free templates, but on the free plan you can only share designs publicly: private links, downloads and embeds start with Premium, at $10 a month billed yearly ($19 monthly). Use the free plan to test the AI, not for files you need to send. For a closer look at Venngage's free plan and tools that fill its gaps, see our free Venngage alternatives.
4. Infogram Basic: interactive charts and maps
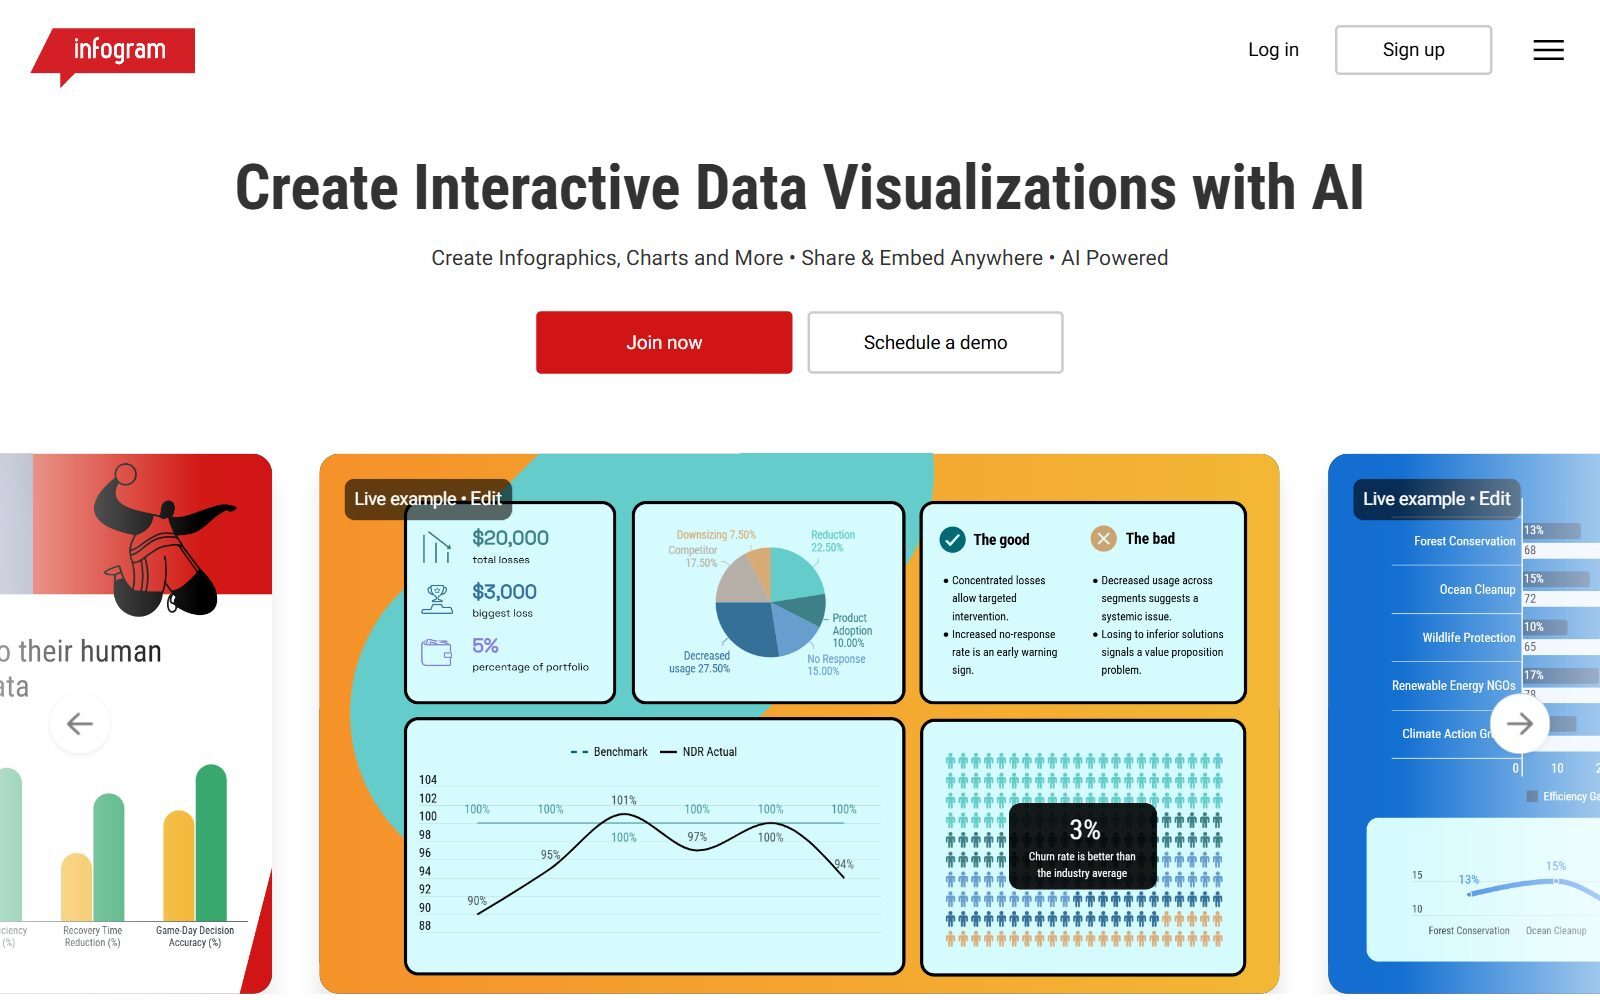
Infogram specialises in data: interactive charts, maps and infographics you publish online and embed. The Infogram pricing page lists the free Basic plan for one user with more than 35 interactive chart types, 13 map types, up to 10 projects with up to 5 pages each, data import and object animations. Downloads as PDF or images and privacy controls start with Pro at $19 a month billed yearly, so on the free plan your work is published online.
5. Adobe Express Free: templates, Adobe Stock and Adobe Fonts
Adobe Express is Adobe's quick-design app for social graphics, flyers, simple infographics and short videos. The Adobe Express pricing page (shown in euros from our location) lists the Free plan at €0 with no credit card, more than 100,000 static and video templates, 5GB of storage, over 1 million royalty-free Adobe Stock assets, more than 4,000 Adobe Fonts, free daily generations for some AI features and 10 days of version history. Premium was listed at €12.19 a month including VAT. For open-source options, see our open-source Adobe Express alternatives.
6. Datawrapper: free charts, maps and tables for your website
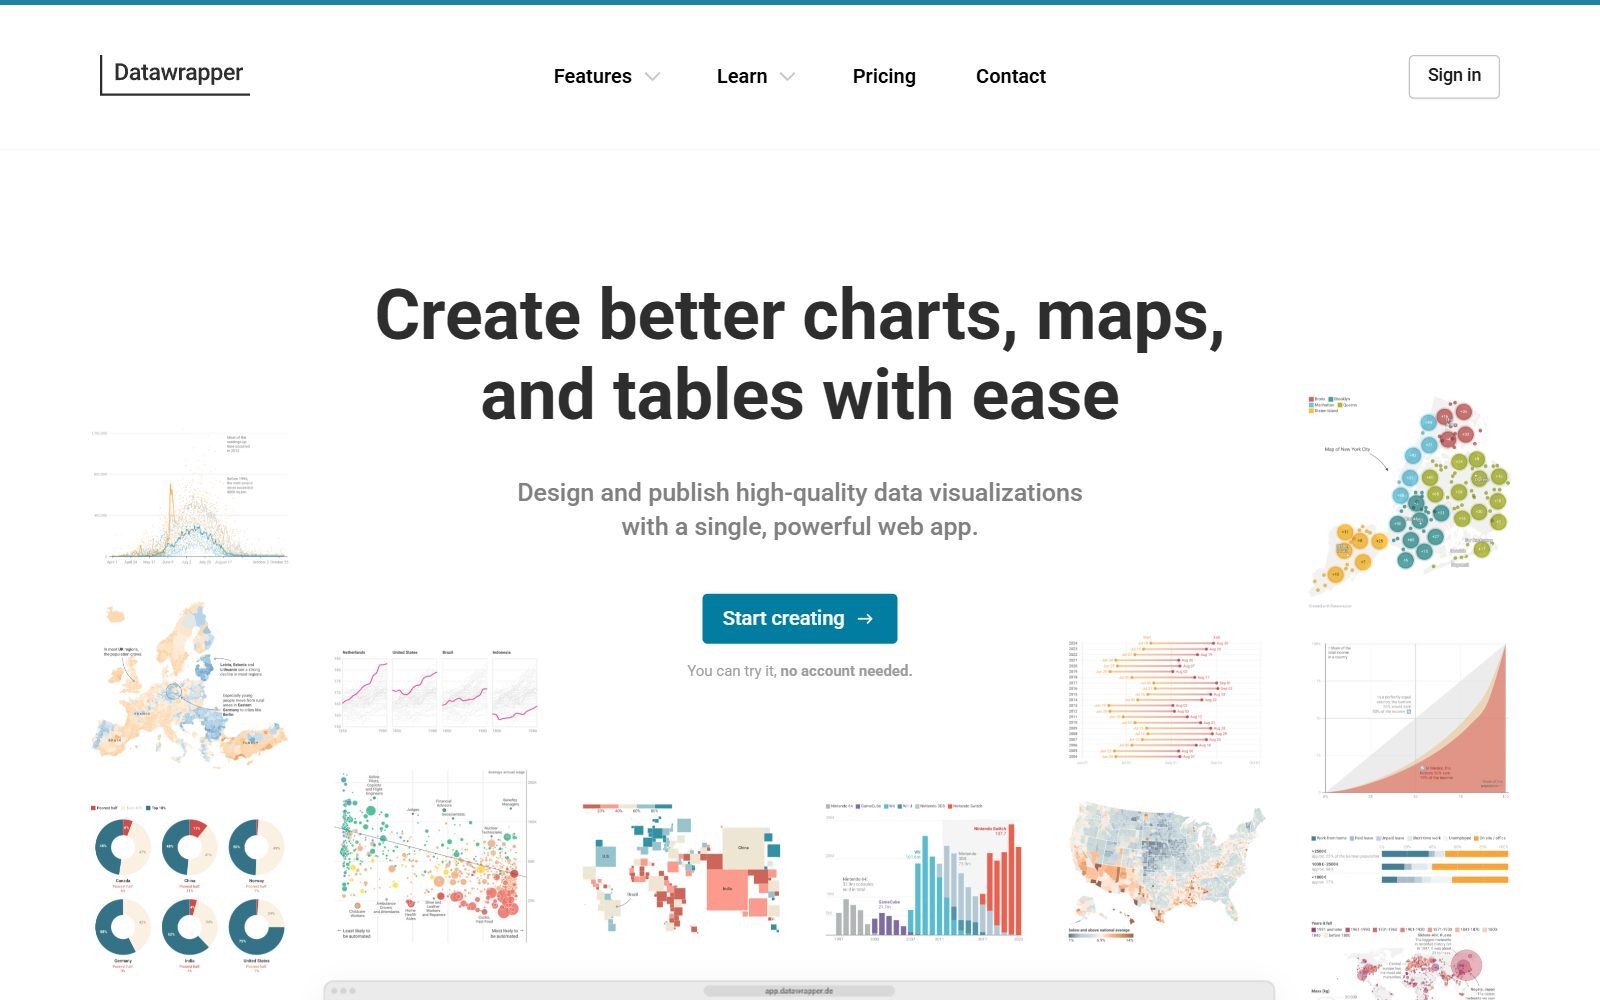
Datawrapper makes clean charts, maps and tables for websites and reports, and its free plan is generous. The Datawrapper pricing page lists the Free plan as "Yes, free": you create, publish and embed interactive charts, maps and tables, download them as PNG images and keep 30 days of edit history; the charts carry a "Created with Datawrapper" attribution. Pro costs $21 per user a month excluding VAT and adds PDF and SVG downloads and removes the attribution. The homepage says you can try it without an account. Datawrapper does not make decorative infographics, so pair it with Canva or Visme for the layout.
7. Flourish Free: interactive data stories
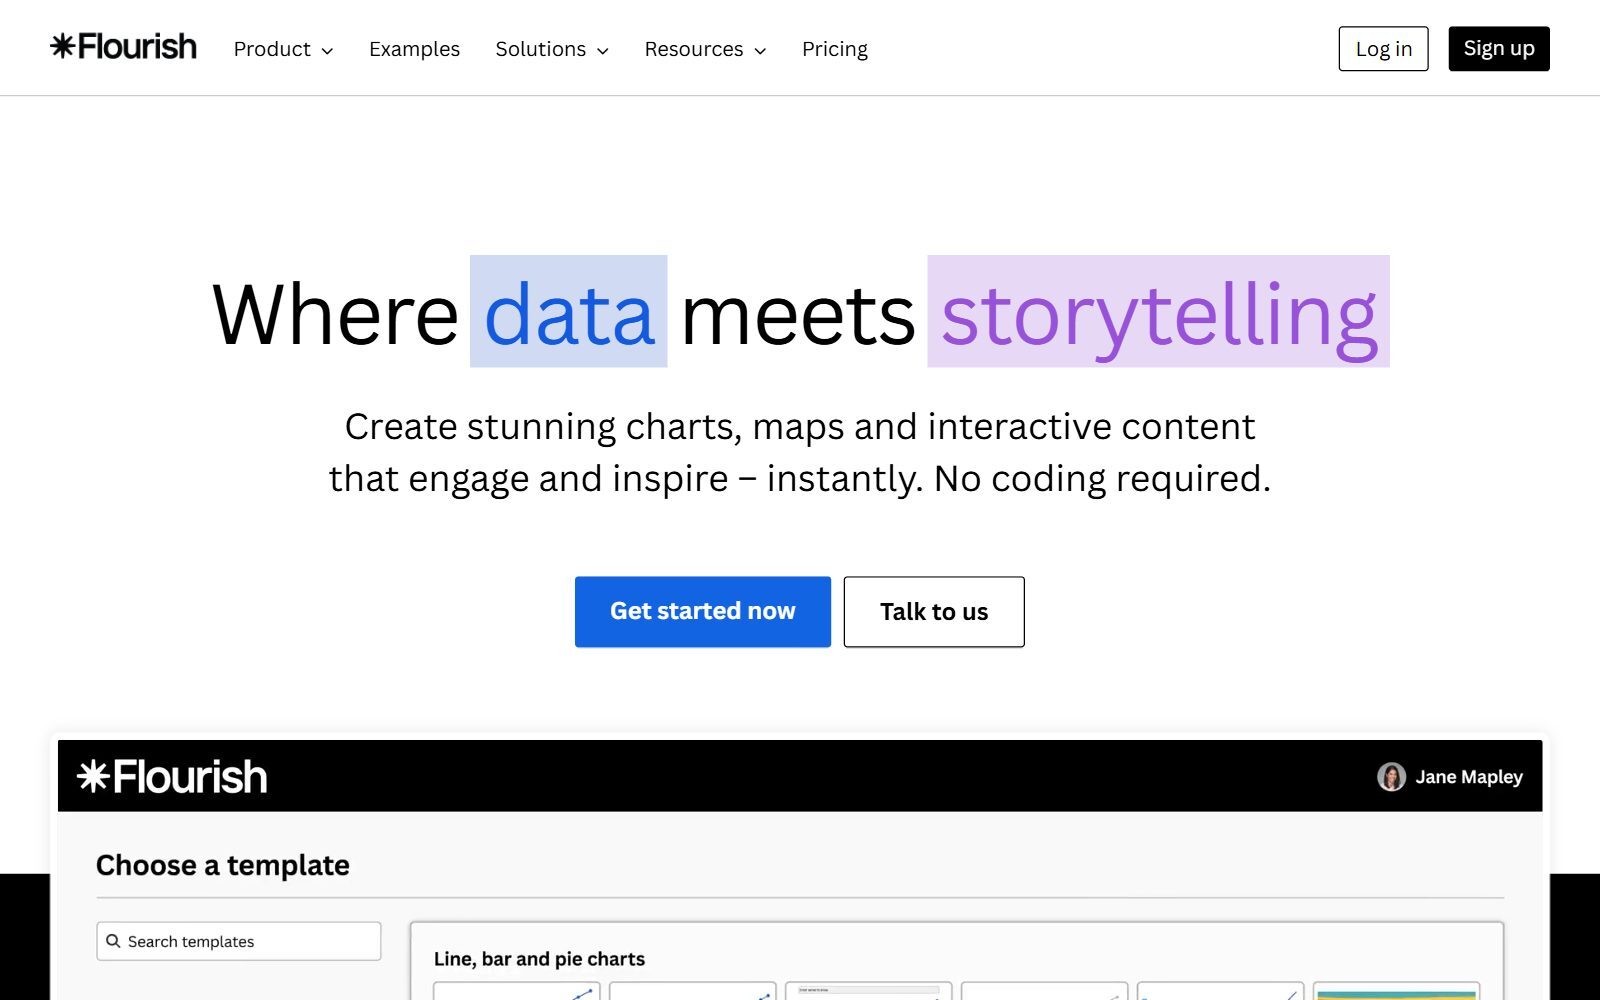
Flourish builds animated, interactive charts, maps and multi-step data stories without code. The Flourish pricing page lists a Free plan with unlimited projects, the full range of templates, full privacy for unpublished projects, responsive graphics, and public publishing and embedding with Flourish attribution. Image and SVG export and PowerPoint charts come with the Presenter plan, which you get through a Canva Business or Enterprise plan. Use the free plan when the chart will live on your website or in an online report.
Validate your startup idea with the unique borrowed authority approach: we publish articles about your product in our blog and you get traffic and testers for your MVP
- Prove Market Demand: See real organic traffic and waitlist conversions
- Unlock High-Potential Keywords: Receive a curated list of top-performing keywords directly from Google Search Console data.
- Estimate Customer Acquisition Cost (CAC): Gain financial foresight with an estimated CAC based on real keyword performance data.
🔗 Start validating your startup now
8. Genially Free: interactive presentations and infographics
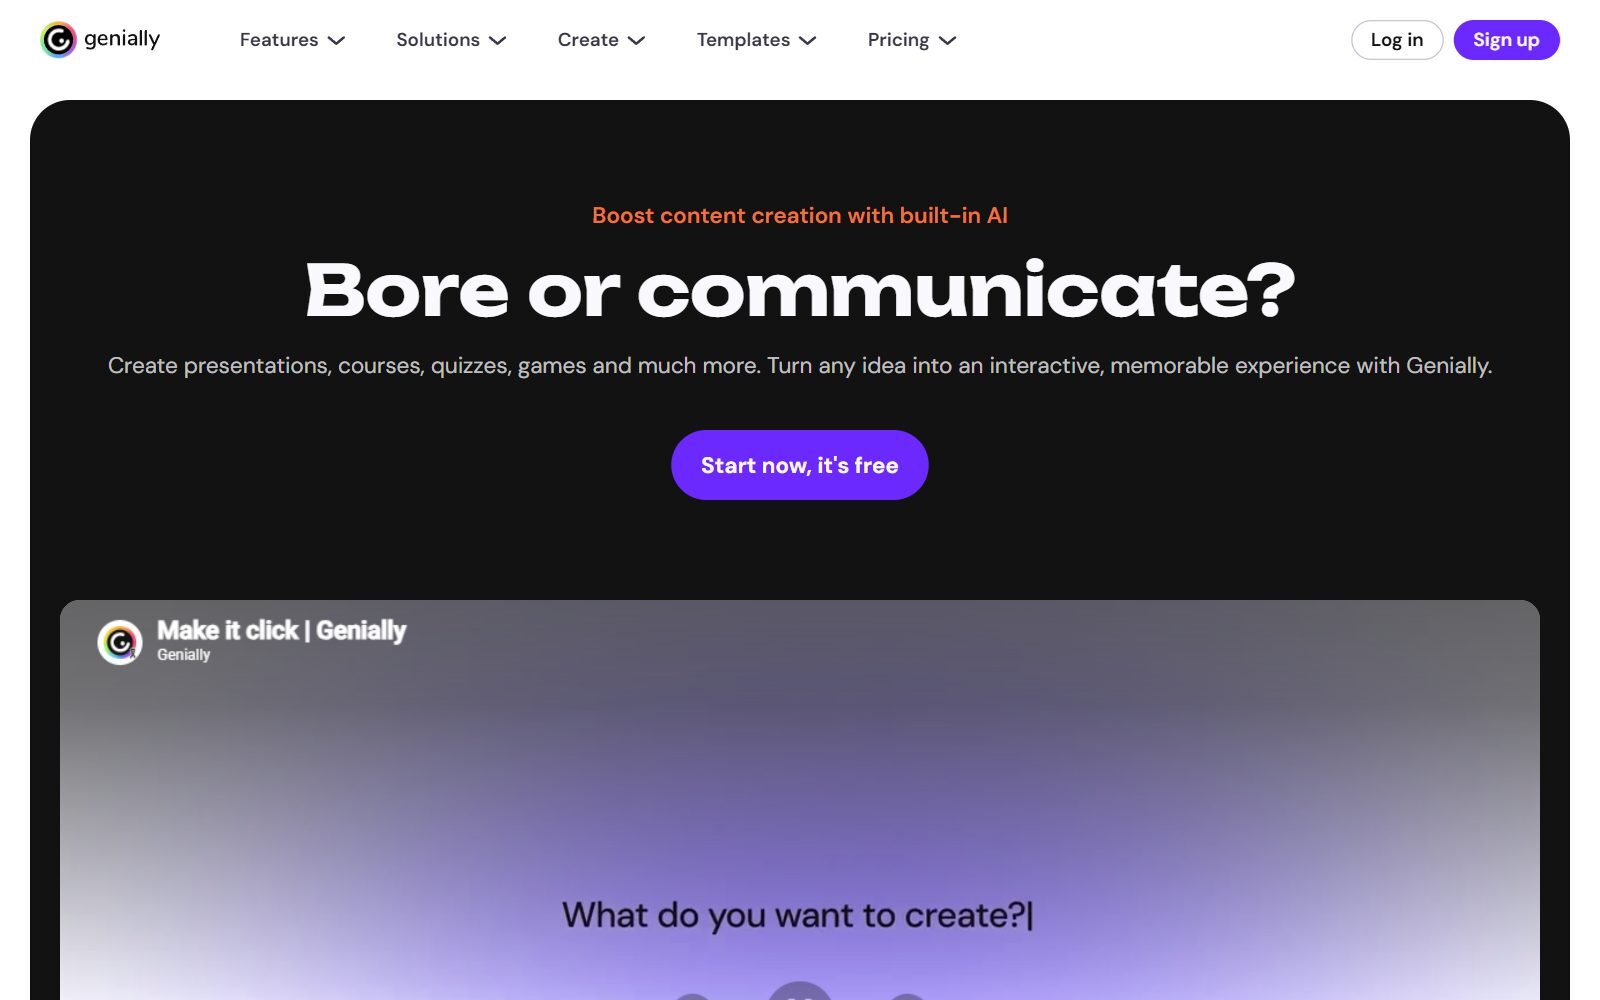
Genially makes interactive content: presentations, infographics, quizzes and training material with clickable elements and animations. On the Genially plans page the Free plan costs €0 and includes more than 1,000 free templates and resources, all interactions, animations and effects, import of PDF, PowerPoint and Google Slides files, 500 AI credits a year and 2 GB of creation storage. Downloads as PDF, JPG or video and private sharing start with Pro at €6 a month billed annually, so free creations are shared online.
9. RAWGraphs: free, open-source charts that keep your data private
RAWGraphs describes itself as a free and open-source tool for data visualization. It offers almost 30 visual models, including less common ones such as circle packing, Gantt, contour and hexagonal binning charts, and you export the result as a vector or raster image to finish in a design tool. The data you paste in is processed only by your web browser, which matters for financial or customer data. The code is released under the Apache 2.0 licence, and version 2.1.0 was released on 8 October 2026. For more free tools to explore data, see our free Metabase AI alternatives.
10. DocHipo Free: documents and infographics without a watermark
DocHipo is a template tool for documents, proposals, presentations and infographics. The DocHipo pricing page lists a Free plan, forever free, with up to 5 documents, unlimited pages, free templates, downloads as JPG and PNG without a watermark and embedding on your website. Premium templates, PDF download and team features need a paid plan.
11. Easil Free: on-brand marketing graphics
Easil is a template-based design tool for marketing teams. The Easil pricing page lists a Free plan with more than 2,500 templates and over 1 million graphic elements and stock images, including a 30-day trial of the Plus plan, which then costs US$7.50 per user a month. Its strength is keeping a team's graphics on brand rather than data visualization.
12. Google Slides: free reports you build with your team
Google Slides is not an infographic maker, but it is a practical free tool for slide-based reports and one-page summaries. Google says anyone with a Google Account can create in Slides, with live editing, comments, sharing controls and version history; some features, such as Slides recording, need a paid Workspace plan. Add charts exported from Datawrapper or RAWGraphs as images.
Removed or Changed Since the 2025 Version
- Picsart, Prezi and WPS Office: removed from this list. They are a photo and video editor, a presentation tool and an office suite, not infographic or report makers, and the free tools above do the Piktochart job better.
- Easelly (easel.ly): its homepage now leads with a paid design service for signs, print and vehicle wraps, starting at $200 a month. Its do-it-yourself design tool is still offered, but its pricing page returned an error when we checked, so we could not confirm its free plan and did not list it.
- Added: Visme, Venngage, Datawrapper, Flourish, Genially and RAWGraphs, which are closer to what Piktochart does.
- Old claims removed: feature claims from the 2025 version that no official page supports were dropped, and every free-plan limit above comes from the current pricing page.
Which Free Piktochart Alternative Should You Choose?
- You want one free tool for infographics, reports and social posts: Canva Free.
- You need to download finished visuals for free: DocHipo (JPG, PNG without a watermark, up to 5 documents), or Datawrapper (PNG) for charts.
- You publish charts and maps on your website or blog: Datawrapper, or Flourish for animated, interactive charts.
- You want an interactive infographic or presentation: Infogram or Genially.
- Your data is confidential: RAWGraphs, which processes data in your browser and is open source.
- You want AI to draft the infographic: Venngage, keeping in mind that free designs can only be shared publicly.
- You already use Adobe or Google tools: Adobe Express or Google Slides.
How Founders Use Free Infographic and Chart Tools
Founders rarely need a designer for their first visuals. They need a clear market chart for the pitch deck, a one-page traction summary for investors, and a few graphics that make a blog post easy to share. A simple workflow: get the numbers right in a spreadsheet, build the chart in Datawrapper or RAWGraphs, and place it in a Canva or Visme layout. Our guide on how to write a pitch deck shows where those charts go, and for market sizing you can pull free public statistics with our free census data alternatives.
For dashboards rather than one-off charts, see our free Looker alternatives; for workshops and visual planning with your team, the free Miro AI alternatives; and for logos and icons, the free Illustrator alternatives. Once your landing page is live, check it with a free landing page analyzer, and turn your best data stories into articles with the F/MS AI SEO Tool so people find you in Google and AI assistants.
Join ElonaHunt (like ProductHunt but for women) and explore the coolest women-focused startups out there!
Discover your next big inspiration and connect with like-minded female entrepreneurs!
👉 Join the Hunt Here
FAQ About Free Piktochart Alternatives
Is Piktochart free?
Piktochart has a free plan with unlimited visual projects, 2 PNG downloads, 60 AI credits, free templates only and 1 GB of storage. Pro, with unlimited PNG downloads, costs $10 per member a month billed annually.
What is the best free alternative to Piktochart?
For most people, Canva Free, because it covers infographics, reports and presentations with a large template library and 5GB of storage. If you need free downloads, DocHipo Free gives JPG and PNG files without a watermark for up to 5 documents; Visme Basic has unlimited projects, but its downloads start on the paid Starter plan.
Which free infographic maker lets you download without paying?
DocHipo Free (JPG and PNG without a watermark, up to 5 documents), Datawrapper (PNG) and RAWGraphs (vector or raster export). Venngage, Visme, Infogram and Genially limit downloads to paid plans.
What is the best free tool for interactive charts?
Datawrapper and Flourish. Both let you publish and embed interactive charts and maps for free, with their attribution shown; Infogram's free plan adds 35+ chart types and 13 map types for up to 10 projects.
Is there an open-source alternative to Piktochart?
RAWGraphs is free and open source under the Apache 2.0 licence. It makes charts rather than full infographics, so export the chart and finish the layout in a design tool.
Can I make an infographic with AI for free?
Yes, with limits. Venngage gives 80 daily AI credits at signup, Piktochart 60 AI credits, Genially 500 AI credits a year, and Canva Free includes limited access to its AI tools.
Is Venngage free?
Venngage has a free plan with 5 designs, 80 daily AI credits and 6 image uploads, but free designs can only be shared publicly; downloads, private links and embeds start with Premium at $10 a month billed yearly.
Is Infogram free?
Yes. Infogram's Basic plan is free for one user, with up to 10 projects of up to 5 pages each, 35+ interactive chart types and 13 map types. Downloads and privacy controls need Pro, at $19 a month billed yearly.
What happened to Easelly?
Easelly's website now leads with a paid design service for signs, print and vehicle wraps. Its do-it-yourself tool is still offered, but we could not confirm its free plan on an official pricing page, so it is not in this list.
Where can I get a backlink by writing about my startup?
You can publish a guest post in one of the Fe/male Switch startup blogs, which rank in Google and in AI tools. Get a quality backlink.
About the Author
Violetta Bonenkamp, also known as MeanCEO, is an experienced startup founder with an impressive educational background including an MBA and four other higher education degrees. She has over 20 years of work experience across multiple countries, including 5 years as a solopreneur and serial entrepreneur. Throughout her startup experience she has applied for multiple startup grants at the EU level, in the Netherlands and Malta, and her startups received quite a few of those. She’s been living, studying and working in many countries around the globe and her extensive multicultural experience has influenced her immensely.

