
Open-Source Tableau Alternatives: Drag-and-Drop Analytics and Dashboards You Can Self-Host
Tableau made drag-and-drop data analysis popular: you drop fields onto rows, columns and colour, and a chart appears. It is also proprietary, sold per user on annual contracts, and its newest AI features sit in the more expensive editions. This guide lists open-source tools that do Tableau's job, from visual exploration to dashboards your whole team can open, and explains what "Tableau AI" is called today. We read each project's licence on its official repository and checked its latest release on 9 November 2026. Tools that turned out to be closed, restricted or no longer released are listed separately.
Quick answer: for shared dashboards that business users can build without code, self-host Apache Superset or Metabase. For Tableau's drag-and-drop feel on your own data in Python, use Graphic Walker through PyGWalker. For desktop analysis without code, pick KNIME or Orange. For live metrics and logs, use Grafana or OpenSearch Dashboards; for SQL teams, Redash or Evidence; and for custom data apps, Streamlit. None of them copies Tableau's AI one to one, but Metabase, Superset and KNIME now have AI helpers of their own.
Boost Your SEO by Getting Featured in Our Blogs and get a backlink.
We publish content about startups, education, tech, funding, etc. that ranks well not only in Google but also in Perplexity, ChatGPT, Grok and other AI tools.
👉 Get featured now!
What Tableau and "Tableau AI" Are in 2027
Tableau belongs to Salesforce, and its prices now appear on Salesforce's analytics pricing page. In the default view (US dollars, per user per month, billed annually, checked 9 November 2026), Tableau Cloud starts at $15 and includes browser-based authoring, Tableau Desktop and Prep Builder, and Tableau Pulse. Tableau Next, the newer agentic analytics product, starts at $40 and adds Tableau Agent, Tableau Semantics (an AI-powered semantic layer) and native Slack integration. Both need an annual contract; the per-role prices sit on Tableau's own pricing page.
There is no product called "Tableau AI" any more. According to the Tableau Next FAQ, Tableau's AI now comes as Tableau Agent inside Tableau Next, which is sold on its own, in a Tableau+ bundle with Tableau Cloud, or inside Salesforce's Core, Advanced and Max CRM editions. Tableau's help page on Tableau Agent describes it as a generative AI assistant that suggests questions, builds charts and explains data in plain language; in Tableau Cloud it requires Tableau+, a free Tableau Cloud trial includes it, and Tableau Server can use it from version 2025.3 with your own LLM provider.
The free option, Tableau Public, comes with a catch. Tableau's own Tableau Public help page says workbooks and data on a Tableau Public profile are not private and anyone can access them. For company data, an open-source tool you host yourself is the safer free route.
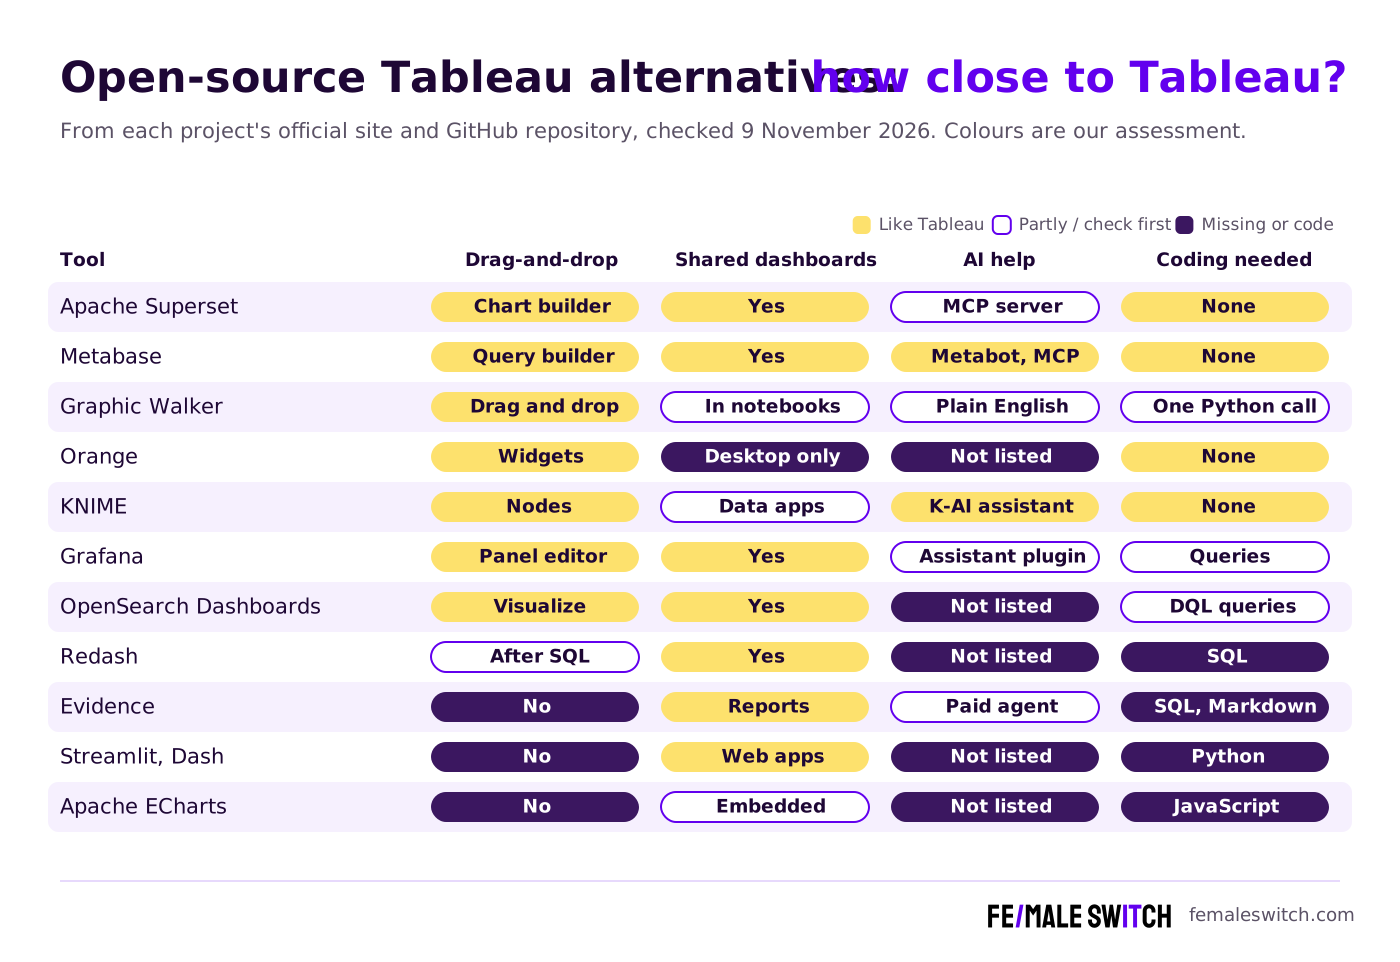
Open-Source Tableau Alternatives Compared
Sources: each project's official website, licence file and GitHub releases, checked 9 November 2026. Self-hosting costs no licence fee, but servers, backups and updates do.
Dashboards for the Whole Team: Closest to Tableau Cloud
1. Apache Superset: no-code charts and dashboards at scale
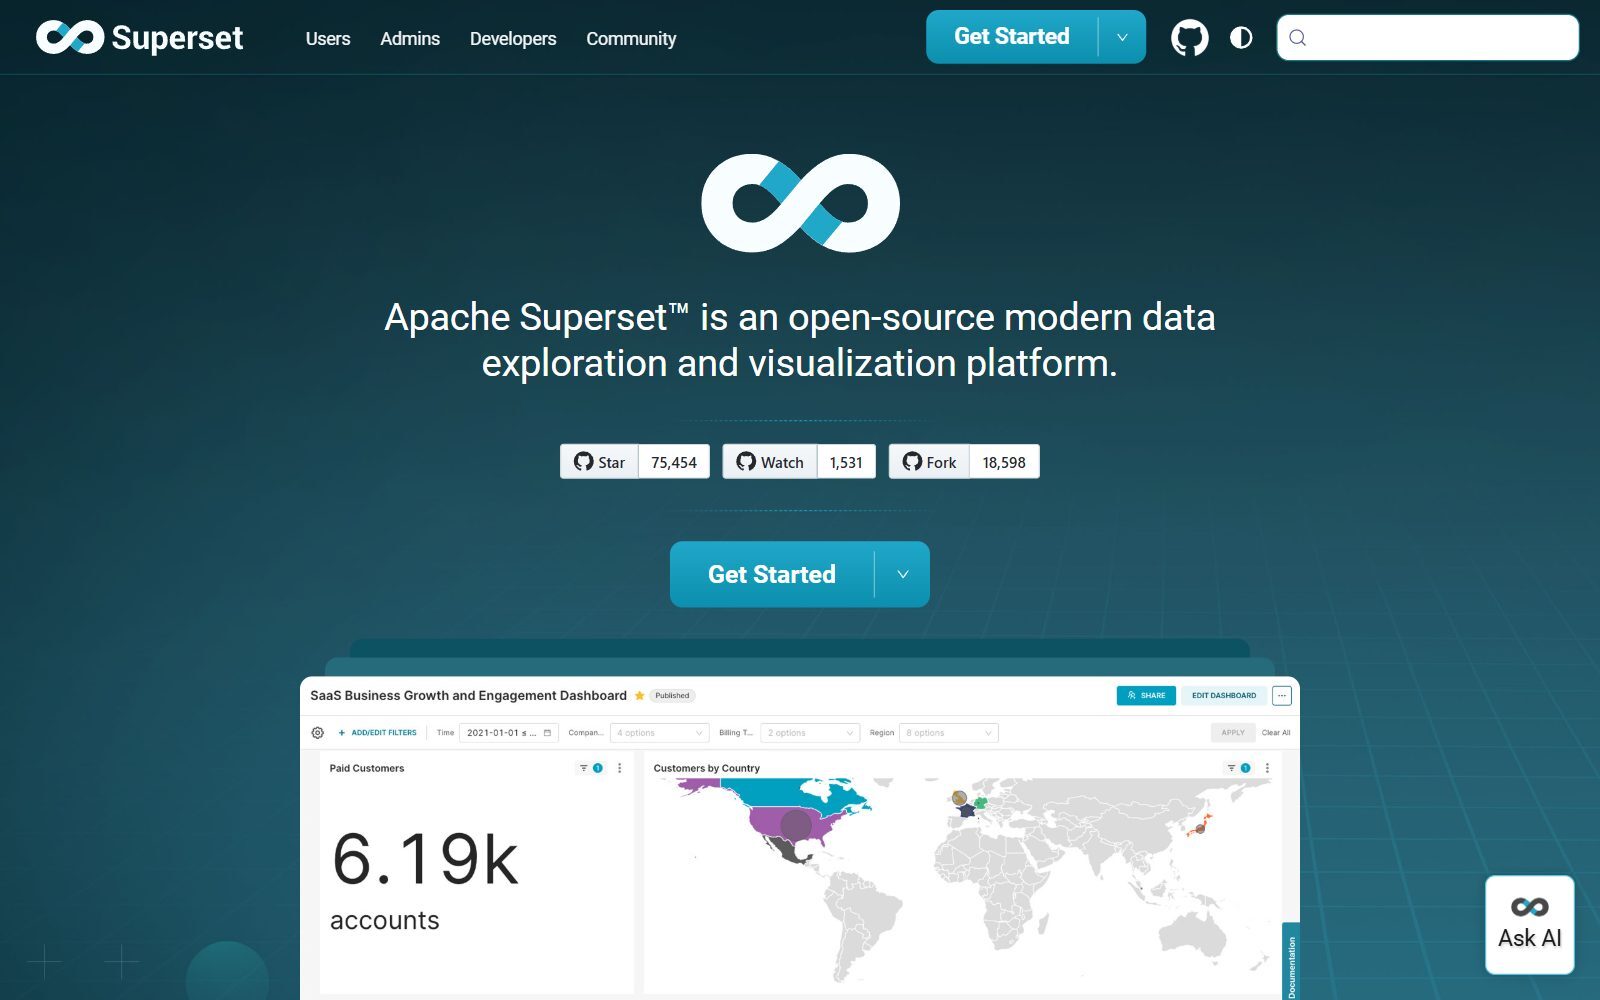
Apache Superset calls itself an open-source modern data exploration and visualization platform. Business users build charts in a no-code chart builder, analysts write SQL in its SQL IDE, and both publish to shared dashboards with filters, from simple line charts to geospatial maps. It is an Apache Software Foundation project under the Apache 2.0 licence; the latest stable release, 6.1.0, came out on 13 May 2026, and 7.0 release candidates appeared in October 2026. For AI, the Superset AI guide explains how to connect Claude, ChatGPT or another MCP client to Superset 5.0 or later and build charts and dashboards in natural language, once an admin has deployed the MCP server.
2. Metabase: the easiest switch for non-technical teams
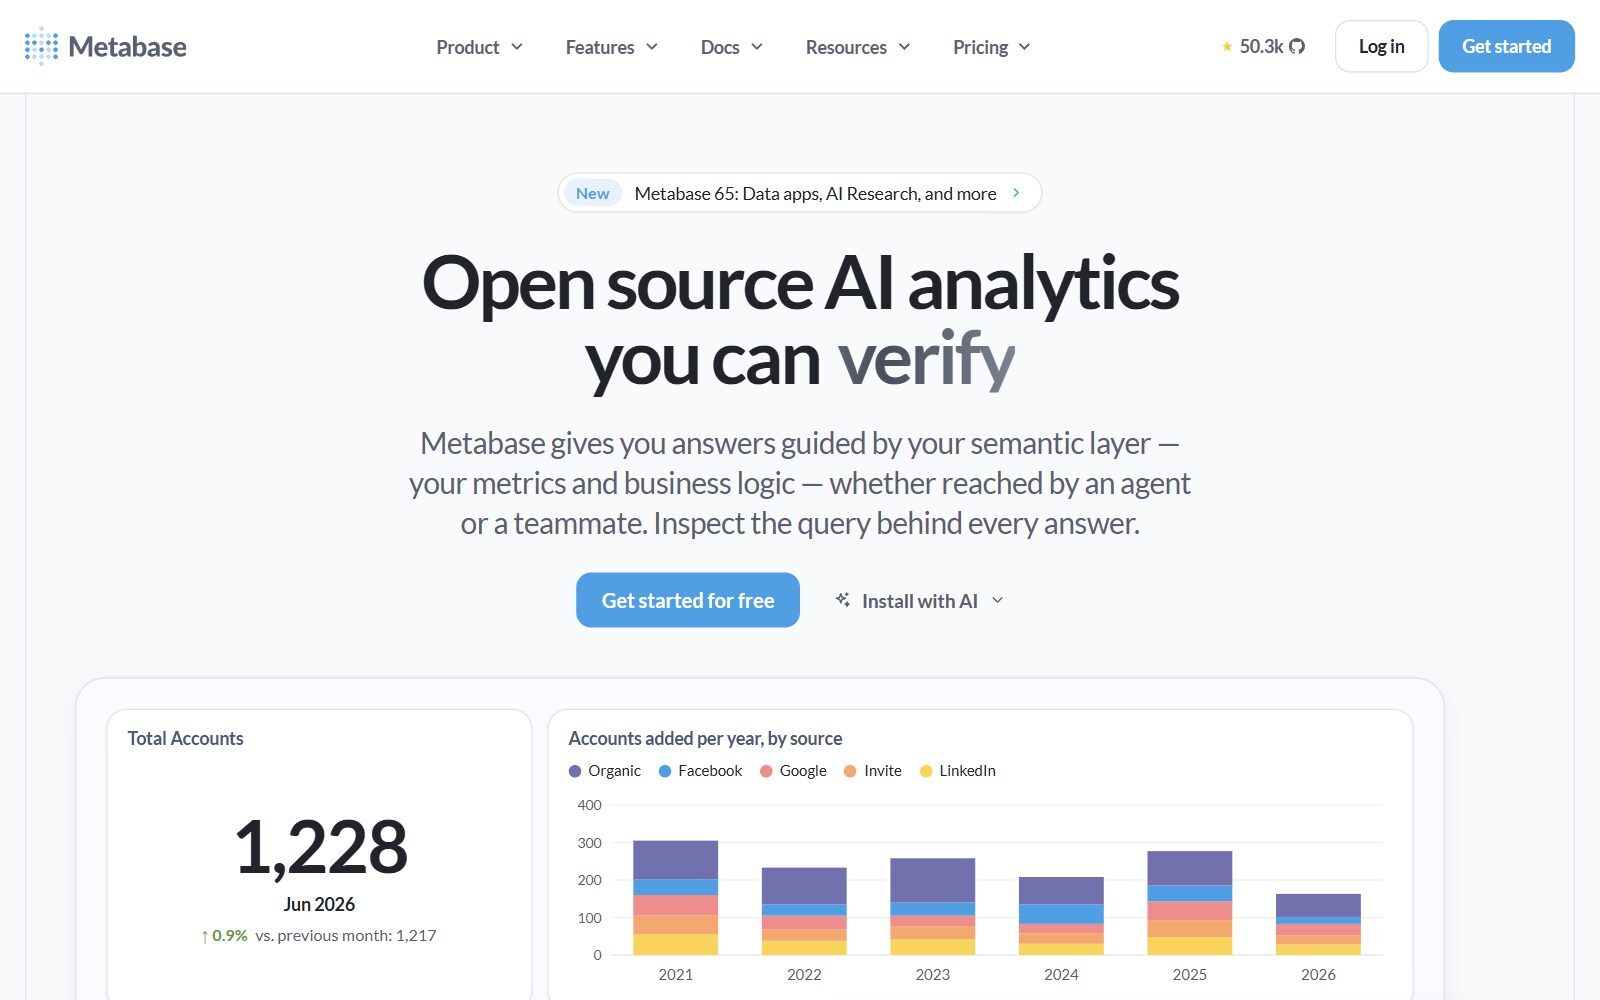
Metabase is the quickest tool here to put in front of a sales or operations team: connect a database, click together a question, save it to a dashboard. Its pricing page lists the Open Source edition as free with unlimited users, more than 20 data sources, an MCP server and AI questions on the model you choose; the hosted Starter plan costs $100 a month on monthly billing with 5 users included, and Pro $575 a month. The open-source edition is AGPL-licensed, and v0.65.3 came out on 6 November 2026. Row-level permissions, SSO and white-labelling are paid features.
Drag-and-Drop Exploration: Closest to Tableau Desktop
3. Graphic Walker and PyGWalker: a Tableau-style canvas for your data
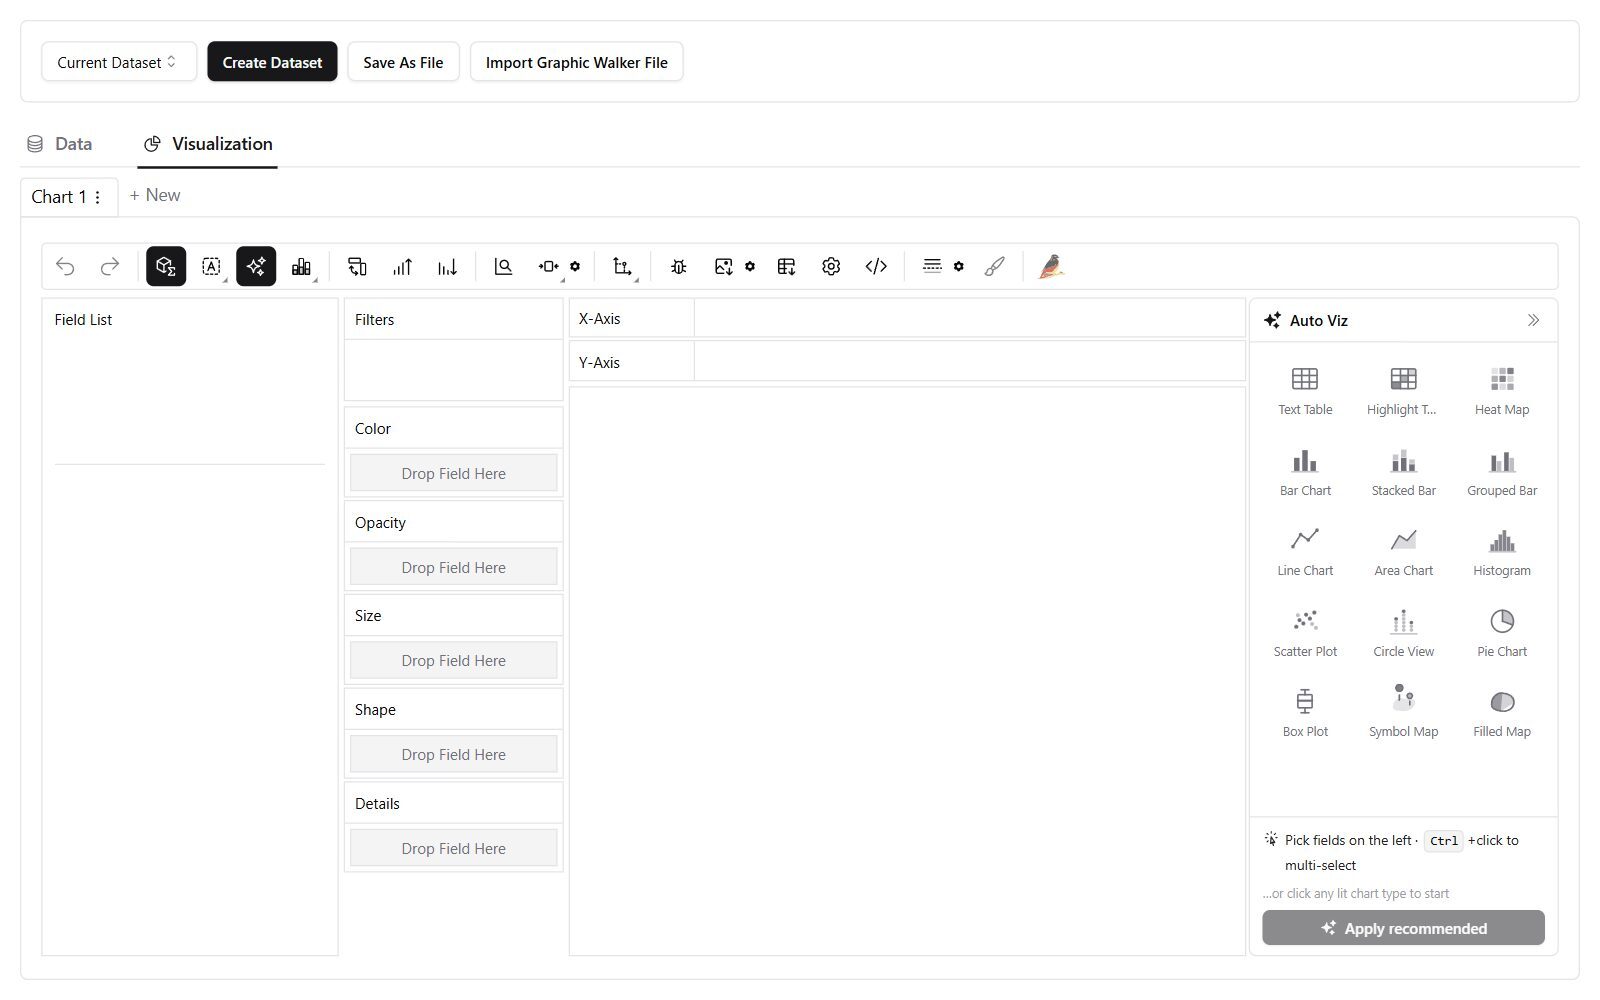
Graphic Walker, from Kanaries, is the tool on this list that looks most like Tableau: a field list, shelves for the X and Y axes, colour, size and shape, and a canvas that redraws as you drop fields. The PyGWalker README calls Graphic Walker "an open-source alternative to Tableau". PyGWalker turns a pandas, polars or pyarrow table into that drag-and-drop interface inside Jupyter, the README mentions natural language queries, and GWalkR does the same in R. Both are Apache 2.0. PyGWalker 0.5.0.1 came out on 4 April 2026, and the Graphic Walker repository still received code in November 2026. You can try it in the online demo.
4. Orange: visual analysis on the desktop, no coding
Orange is open-source machine learning and data visualization software from the University of Ljubljana. You place widgets on a canvas, connect them and load your data, then explore scatter plots, box plots, distributions, heatmaps and decision trees; add-ons cover text mining, networks and time series. The Orange repository is GPL-3.0 or later, and release 3.41.0 was published there on 8 November 2026. Orange is strong for teaching and one-person analysis, but it has no server for sharing dashboards with a team.
5. KNIME Analytics Platform: data prep, analysis and charts in one workflow
KNIME Analytics Platform is "open and free" desktop software where you build workflows from nodes: more than 300 connectors to data sources, data blending and cleaning, interactive charts and machine learning, with Python, R and JavaScript when you need them. It is published under the GPL version 3 with additional permissions. Its AI assistant, K-AI, is the closest open-source answer to Tableau Agent: in the release notes for version 5.12 (6 July 2026), K-AI inspects your workflow before it builds and can turn a workflow into a data app.
Validate your startup idea with the unique borrowed authority approach: we publish articles about your product in our blog and you get traffic and testers for your MVP
- Prove Market Demand: See real organic traffic and waitlist conversions
- Unlock High-Potential Keywords: Receive a curated list of top-performing keywords directly from Google Search Console data.
- Estimate Customer Acquisition Cost (CAC): Gain financial foresight with an estimated CAC based on real keyword performance data.
🔗 Start validating your startup now
Live Metrics, Logs and SQL Dashboards
6. Grafana: dashboards for metrics as they happen
Grafana is the open-source standard for operational dashboards: sign-ups per minute, server load, payments, anything stored as time series. It connects to data sources through more than 150 plugins, ranges from time-series graphs to heatmaps, and keeps dashboards as code; version 13 added dashboard templates and an AI agent through the Grafana Assistant plugin. The Grafana repository is AGPL-3.0, and v13.3.0 came out on 27 October 2026. It is less suited to ad-hoc business analysis than Superset or Metabase.
7. OpenSearch Dashboards: search and log analytics without Elastic's licence
OpenSearch Dashboards is the visualization layer of OpenSearch, a Linux Foundation project. You explore data as it streams in, filter with the Dashboards Query Language, build dashboards and use alerting, anomaly detection and security analytics. The OpenSearch Dashboards repository is Apache 2.0, and 3.9.0 came out on 12 October 2026. It suits product events, logs and search data more than finance reports.
8. Redash: SQL first, dashboards second
Redash combines a browser SQL editor with visualisations, drag-and-drop dashboards, scheduled refreshes, alerts and an API, and queries SQL, NoSQL and API sources. The Redash repository is BSD-2-Clause, and v26.9.0 came out on 24 September 2026. It suits a team where one person writes SQL and everyone else reads dashboards; there is no drag-and-drop chart building from raw fields.
Data Stories, Apps and Embedded Charts
9. Evidence: reports and data stories as code
Evidence is "business intelligence as code": you write reports in SQL and Markdown, keep them in Git and publish them as a website, which makes it a good replacement for Tableau Story points and monthly board reports. Its website says Evidence Core is open source, and the Evidence repository is MIT and still active in November 2026, although its last package releases date from February 2026. The hosted Evidence platform, with an analytics agent that answers questions in plain language, is a paid product.
10. Streamlit and Plotly Dash: interactive data apps in Python
When a dashboard turns into a small tool, such as a pricing calculator, a forecast with sliders or an internal app, Tableau gets awkward and Python frameworks take over. Streamlit turns data scripts into shareable web apps in pure Python; it is Apache 2.0 and released 1.67.0 on 5 November 2026, and its Community Cloud hosts public apps for free. Plotly Dash is the MIT-licensed alternative for more complex, callback-driven apps; v4.5.0 came out on 29 October 2026. Both need someone who writes Python.
11. Apache ECharts: Tableau-quality charts inside your own product (a library)
Apache ECharts is not a BI tool but an open-source JavaScript visualization library, listed here for startups that want to show charts to their own customers instead of embedding Tableau. It offers more than 20 chart types, switches between Canvas and SVG rendering, and is Apache 2.0; version 6.1.0 came out on 19 May 2026.
Changed, Closed or Not Like-for-Like
The 2025 version of this article listed ten tools. Superset, Metabase, Grafana, Redash and KNIME stay. Here is what happened to the rest, plus names you will meet in other Tableau comparisons:
- "Tableau AI": no longer a product name. Tableau's AI is now Tableau Agent, sold through Tableau Next, Tableau+ or Salesforce CRM editions.
- Pentaho Community Edition: the old Hitachi Vantara page is gone, and Pentaho's site now offers a Developer Edition that is only available to students and universities. We removed it.
- Plotly Dash: still active (MIT), now covered together with Streamlit as a framework for data apps rather than a Tableau replacement.
- RAWGraphs: still online and Apache 2.0, and handy for one-off chart designs, but its last release, v2.0.1, dates from January 2024.
- Eclipse BIRT: active (EPL-2.0, 4.25.0 in September 2026), but it is a report designer for Java applications, not a visual analysis tool.
- Helical Insight: still AGPL-3.0 and active (7.0.0 in July 2026); we cover it in our open-source Power BI and Metabase guides.
- Kibana: its code is published under a choice of AGPLv3, SSPL or the Elastic License 2.0, and some parts only under the Elastic License, so we list OpenSearch Dashboards, which is fully Apache 2.0, instead.
Which Open-Source Tableau Alternative Should You Choose?
- Your team needs shared dashboards and some people write SQL: Apache Superset.
- Your team does not write SQL and wants answers this week: Metabase.
- You miss Tableau's drag-and-drop shelves and work in Python or R: Graphic Walker through PyGWalker or GWalkR.
- You analyse data alone on a laptop and do not code: KNIME, or Orange for teaching and quick exploration.
- You watch live product or server metrics: Grafana.
- You analyse logs, events or search data: OpenSearch Dashboards.
- Your analyst lives in SQL: Redash for dashboards, Evidence for written reports.
- You need an interactive tool, not a dashboard: Streamlit or Plotly Dash.
- You want charts inside your own app: Apache ECharts.
- You want a free tool and do not want to host anything: see our free hosted BI options, and remember that Tableau Public makes everything you publish public.
How Founders Replace Tableau With Open-Source Tools
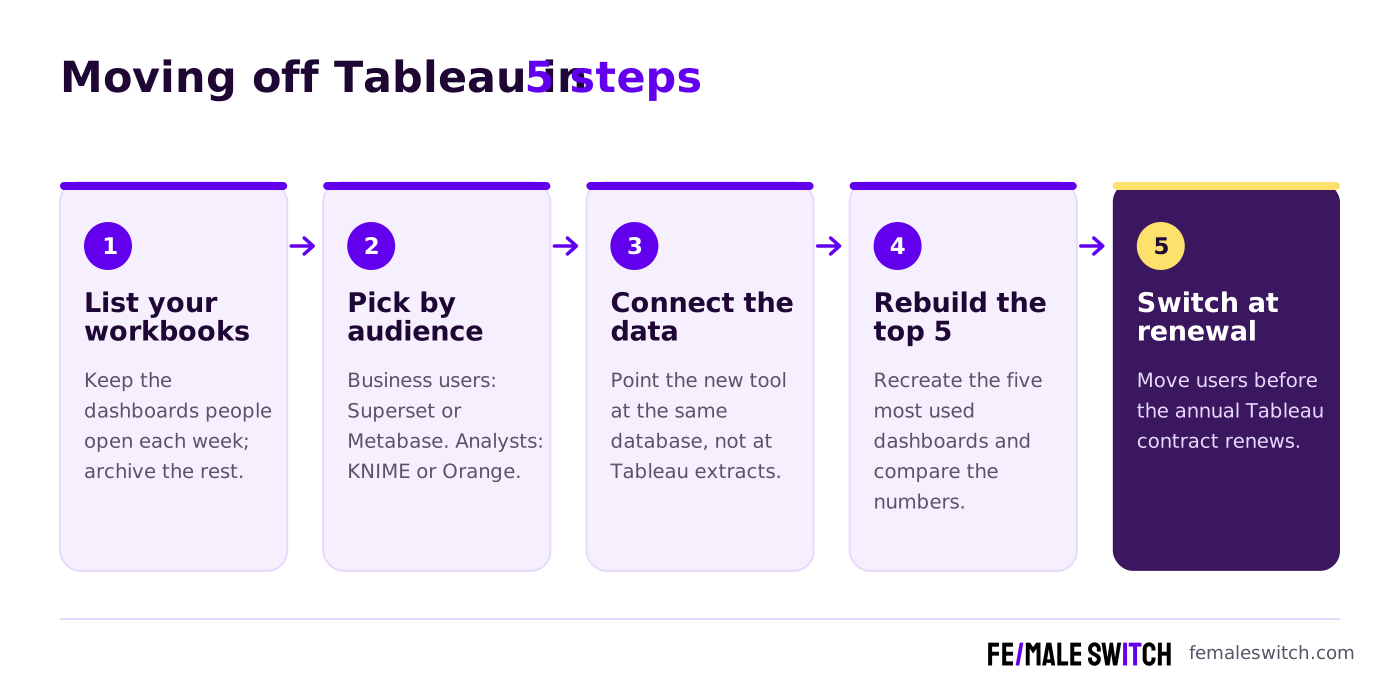
Most startups never need Tableau's full suite. A typical setup is one self-hosted BI tool (Superset or Metabase) on top of the product database or a small warehouse, plus a desktop tool (KNIME or Orange) for the one person who digs deeper. Rebuild the five dashboards people actually open, compare the numbers with Tableau for a month, and move users before the annual contract renews. Start with the numbers that matter: our guide to the key metrics in a business model canvas and the 30-day validation sprint help you decide what to chart first.
Leaving other BI tools as well? Compare our open-source Power BI alternatives for Microsoft teams, the open-source Looker alternatives for semantic layers and governed metrics, and the open-source Metabase alternatives for more self-hosted BI tools. If you would rather not host anything, read our free Looker alternatives and free Metabase AI alternatives, which cover tools that answer questions in plain English.
For the data underneath, see the open-source Snowflake alternatives, open-source Databricks alternatives and Databricks alternatives; to collect product events, the open-source Segment alternatives and open-source Mixpanel alternatives; and for website traffic, the open-source Google Analytics alternatives and free Google Analytics alternatives.
Many founders keep their first data in a spreadsheet-style database: the open-source Airtable alternatives and open-source AppSheet alternatives cover that, the open-source Retool alternatives help you build internal tools on the same data, and the open-source Zapier alternatives move it between apps. For charts in pitch decks and posts, see the free Piktochart alternatives and our pie chart generators; for public market data, the free census data alternatives. If you want an AI model to write SQL for you on your own server, start with the open-source ChatGPT alternatives, and plan the spend with the marketing budget calculator.
Join ElonaHunt (like ProductHunt but for women) and explore the coolest women-focused startups out there!
Discover your next big inspiration and connect with like-minded female entrepreneurs!
👉 Join the Hunt Here
FAQ About Open-Source Tableau Alternatives
Is Tableau open source?
No. Tableau is proprietary software owned by Salesforce. Open-source alternatives such as Apache Superset, Metabase, Graphic Walker, KNIME and Orange can be downloaded, self-hosted and changed.
How much does Tableau cost in 2027?
When we checked in November 2026, Salesforce's analytics pricing page listed Tableau Cloud from $15 per user a month and Tableau Next from $40 per user a month, in US dollars, billed annually on an annual contract.
What is Tableau AI called now?
Tableau's AI is now Tableau Agent, a generative AI assistant that builds charts and answers questions in plain language. It comes with Tableau Next, the Tableau+ bundle or Salesforce CRM editions; in Tableau Cloud it requires Tableau+.
What is the best open-source alternative to Tableau?
For shared dashboards, Apache Superset (Apache 2.0) or Metabase (AGPL). For Tableau's drag-and-drop feel in Python notebooks, Graphic Walker through PyGWalker. For desktop analysis without code, KNIME or Orange.
Is there an open-source tool that looks like Tableau?
Graphic Walker comes closest: a field list, shelves for axes, colour, size and shape, and a canvas that redraws as you drop fields. Its PyGWalker README calls it an open-source alternative to Tableau.
Is there an open-source alternative to Tableau Agent?
Partly. Metabase's open-source edition includes AI questions on the model you choose and an MCP server, Superset 5.0 and later can connect Claude or ChatGPT through MCP to build charts, and KNIME's K-AI assistant builds workflows and data apps.
Is Tableau Public a free alternative?
Only for public data. Tableau's help pages say workbooks and data on a Tableau Public profile are not private and anyone can access them, so do not use it for customer or company data.
Is Pentaho Community Edition still available?
Not as it was. Pentaho's site now offers a Developer Edition that is only available to students and universities, and the old Community Edition page is gone.
What does self-hosting a BI tool cost?
No licence fee, but you pay for a server, backups and someone's time for updates and security. Metabase offers a paid cloud plan if hosting becomes a burden.
Where can I get a backlink by writing about my startup?
You can publish a guest post in one of the Fe/male Switch startup blogs, which rank in Google and in AI tools. Get a quality backlink.
About the Author
Violetta Bonenkamp, also known as MeanCEO, is an experienced startup founder with an impressive educational background including an MBA and four other higher education degrees. She has over 20 years of work experience across multiple countries, including 5 years as a solopreneur and serial entrepreneur. Throughout her startup experience she has applied for multiple startup grants at the EU level, in the Netherlands and Malta, and her startups received quite a few of those. She’s been living, studying and working in many countries around the globe and her extensive multicultural experience has influenced her immensely.

